I decided to work on a movie recommendation engine since it seems like one of the first pet projects machine learning classes tend to recommend (like in this Udacity course). In this post, I will attempt to use both the Content-based Filtering approach and the Collaborative Filtering approach to build a basic movie recommendation engine.
The Dataset
The dataset used was from MovieLens, and is publicly available here. In a bid to keep the recommender simple, I used the smallest dataset available (ml-latest-small.zip) –100,000 ratings and 2,488 tag applications applied to 8,570 movies by 706 users.
>str(movies)
‘data.frame’: 8570 obs. of 3 variables:
$ movieId: int 1 2 3 4 5 6 7 8 9 10 …
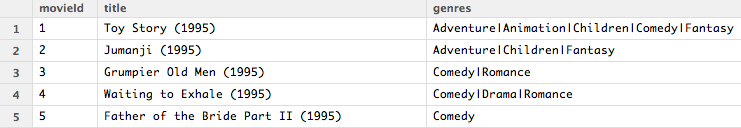
$ title : chr “Toy Story (1995)” “Jumanji (1995)” “Grumpier Old Men (1995)”…
$ genres : chr “Adventure|Animation|Children|Comedy|Fantasy”…
>str(ratings)
‘data.frame’: 100023 obs. of 3 variables:
$ userId : int 1 1 1 1 1 1 1 1 1 1 …
$ movieId : int 6 22 32 50 110 164 198 260 296 303 …
$ rating : num 2 3 2 5 4 3 3 5 4 3 …

The Content-based Filtering Approach
Like the name suggests, the Content-based Filtering approach involves analyzing an item a user interacted with, and giving recommendations that are similar in content to that item. Content, in this case, refers to a set of attributes/features that describes your item. For a movie recommendation engine, a content-based approach would be to recommend movies that are of highest similarity based on its features, such as genres, actors, directors, year of production, etc. The assumption here is that users have preferences for a certain type of product, so we try to recommend a similar product to what the user has expressed liking for. Also, the goal here is to provide alternatives or substitutes to the item that was viewed.
In this post, I will be building a basic content-based recommender engine based on movie genres only. In more complicated engines, it is possible to include several attributes and place higher weights on attributes that have been decided to be more important. This could be done with methods such as the Term Frequency–Inverse Document Frequency algorithm (TFIDF). To build a simple content-based recommender engine, a user profile is necessary to determine what a user is inclined to prefer, and can be constructed based on the user’s preferences or viewing behavior.
Data Preprocessing
To obtain the movie features matrix, the pipe-separated genres available in the movies dataset had to be split. The data.table package has a tstrsplit() function that works well here to perform string splits.
genres <- as.data.frame(movies$genres, stringsAsFactors=FALSE)
library(data.table)
genres2 <- as.data.frame(tstrsplit(genres[,1], '[|]', type.convert=TRUE), stringsAsFactors=FALSE)
colnames(genres2) <- c(1:7)
This will give us a matrix that looks like this. This is basically movies$genres but each genre is separated into columns.

Then you create a matrix with columns representing every unique genre, and indicate whether a genre was present or not in each movie.
genre_list <- c("Action", "Adventure", "Animation", "Children", "Comedy", "Crime","Documentary", "Drama", "Fantasy","Film-Noir", "Horror", "Musical", "Mystery","Romance","Sci-Fi", "Thriller", "War", "Western")

genre_matrix <- matrix(0,8571,18) #empty matrix
genre_matrix[1,] <- genre_list #set first row to genre list
colnames(genre_matrix) <- genre_list #set column names to genre list

#iterate through matrix
for (i in 1:nrow(genres2)) {
 for (c in 1:ncol(genres2)) {
 genmat_col = which(genre_matrix[1,] == genres2[i,c])
 genre_matrix[i+1,genmat_col] <- 1
 }
}

#convert into dataframe
genre_matrix2 <- as.data.frame(genre_matrix[-1,], stringsAsFactors=FALSE) #remove first row, which was the genre list
for (c in 1:ncol(genre_matrix2)) {
  genre_matrix2[,c] <- as.integer(genre_matrix2[,c])
} #convert from characters to integers
We have now obtained the movie genres matrix. Each column represents a unique movie genre, and each row is a unique movie. The table below just shows a preview of what the dataset looks like. We have 18 unique genres and 8570 unique movies.

Now, what we need is a user profile matrix. This can be easily done with the dcast() function in the reshape2 package. I first convert the ratings into a binary format to keep things simple. ratings of 4 and 5 are mapped to 1, representing likes, and ratings of 3 and below are mapped to -1, representing dislikes.
binaryratings <- ratings
for (i in 1:nrow(binaryratings)){
 if (binaryratings[i,3] > 3){
   binaryratings[i,3] <- 1
 }
 else{
   binaryratings[i,3] <- -1
 }
}
This is what the binaryratings dataset looks like now:

To obtain the binaryratings matrix in the correct format we need, I use the dcast() function in the reshape2 package. This basically transforms the data from a long format to a wide format. This also creates many NA values because not every user rated every movie. I substituted the NA values with 0.
binaryratings2 <- dcast(binaryratings, movieId~userId, value.var = "rating", na.rm=FALSE)
for (i in 1:ncol(binaryratings2)){
  binaryratings2[which(is.na(binaryratings2[,i]) == TRUE),i] <- 0
}
binaryratings2 = binaryratings2[,-1] #remove movieIds col. Rows are movieIds, cols are userIds
Now we have the binaryratings matrix in the right format. This matrix has 8552 rows, representing the movieIds, and 706 cols, representing the userIds. The matrix now looks something like this:

To create the simple user profile matrix, I calculated the dot product of the movie genre matrix and the binaryratings matrix. Before we proceed with the dot product, you might notice that the movies dataset has 8570 movies, but the ratings dataset only has 8552 movies. To deal with this, I removed the movies that have never been rated from the genres matrix.
#Remove rows that are not rated from movies dataset
movieIds <- length(unique(movies$movieId)) #8570
ratingmovieIds <- length(unique(ratings$movieId)) #8552
movies2 <- movies[-which((movieIds %in% ratingmovieIds) == FALSE),]
rownames(movies2) <- NULL
#Remove rows that are not rated from genre_matrix2
genre_matrix3 <- genre_matrix2[-which((movieIds %in% ratingmovieIds) == FALSE),]
rownames(genre_matrix3) <- NULL
Now we can calculate the dot product of the genre matrix and the ratings matrix and obtain the user profiles.
#Calculate dot product for User Profiles
result = matrix(0,18,706)
for (c in 1:ncol(binaryratings2)){
  for (i in 1:ncol(genre_matrix3)){
    result[i,c] <- sum((genre_matrix3[,i]) * (binaryratings2[,c]))
  }
}

#Convert to Binary scale
for (i in 1:nrow(result)){
  if (result[i] < 0){
    result[i] <- 0
  }
  else {
    result[i] <- 1
  }
}
This user profiles shows the aggregated inclination of each user towards movie genres. Each column represents a unique userId, and positive values shows a preference towards a certain genre. The values were again simplified into a binary matrix — positive values were mapped to 1 to represent likes, negative values were mapped to 0 to represent dislikes.
Now that we have the user profiles, we can go 2 ways from here.
1) Predict if a user likes an item based on the item descriptions (movie genres). This can be done by predicting user movie ratings.
2) Assume that users like similar items, and retrieve movies that are closest in similarity to a user’s profile, which represents a user’s preference for an item’s feature.
I chose the second way, and decided to use Jaccard Distance to measure the similarity between user profiles, and the movie genre matrix. Jaccard Distance was my metric of choice for being suitable for binary data.
I used the dist() function from the proxy library to calculate Jaccard Distance. Unfortunately, it seems like it calculates the distance between rows from a single matrix, and I had 2 matrices. I decided to combine the genre matrix with the user profile matrix one at a time, and retrieve the minimum distance for each user. This calculation took quite a while in my local environment.
For the sake of simplicity, I will show how I did it with the first user in the dataset.
result2 <- result[1,] #First user's profile
sim_mat <- rbind.data.frame(result2, genre_matrix3)
sim_mat <- data.frame(lapply(sim_mat,function(x){as.integer(x)})) #convert data to type integer

#Calculate Jaccard distance between user profile and all movies
library(proxy)
sim_results <- dist(sim_mat, method = "Jaccard")
sim_results <- as.data.frame(as.matrix(sim_results[1:8552]))
rows <- which(sim_results == min(sim_results))
#Recommended movies
movies[rows,2]
We have now successfully generated some recommendations for the first user in the dataset. You can repeat this for every user in your dataset with a for loop to get recommendations for all your users.
Let’s take a look at the results.
This is the user profile we created for user 1. User 1 has an inclination towards the following genres: Children, Documentary, Fantasy, Horror, Musical, War

These were the movies recommended for User 1:

These movies returned a similarity score of 0.5. One of the biggest takeaways we can make here is that movieId 4291 and 65585 scored high in terms of similarity because it only had 2 genres recorded. User 1 had only shown a preference for Comedies, and not Crime nor Romance, so these do not seem like quality recommendations. One way to get by this is to give every genre an equal weightage. This can be done by dividing each value in the genre matrix by the square root of that item’s total number of genres. For item 2015, that will be 1/sqrt(3), and for item 4291, that will be 1/sqrt(2). Giving each genre an equal weightage should improve the quality of the recommendations.
Now that we are done with a simple content-based recommender, let’s consider its strengths and weaknesses in general.
Strengths: Content-based recommender systems don’t require a lot of user data. You just need item data and you’re able to start giving recommendations to users. Also, your recommendation engine does not depend on lots of user data, so it is possible to give recommendations to even your first customer as long as you have adequate data to build his user profile.
Weaknesses: Your item data needs to be well distributed. It won’t be effective to have a content-based recommender if 80% of your movies are action movies. Also, the recommendations you get will likely be direct substitutes, and not complements, of the item the user interacted with. Complements are more likely discovered through collaborative techniques, which will be discussed in a later section.
Now we move on to the next approach!
The User-Based Collaborative Filtering Approach
The User-Based Collaborative Filtering approach groups users according to prior usage behavior or according to their preferences, and then recommends an item that a similar user in the same group viewed or liked. To put this in layman terms, if user 1 liked movie A, B and C, and if user 2 liked movie A and B, then movie C might make a good recommendation to user 2. The User-Based Collaborative Filtering approach mimics how word-of-mouth recommendations work in real life.
In this post, I will use User-Based Collaborative Filtering to generate a top-10 recommendation list for users using the recommenderlab package available in R. The recommenderlab package makes it really easy to implement some of the popular collaborative filtering algorithms.
Data Preprocessing
We need a ratings matrix to build a recommender model with recommenderlab. This can, again, be easily done with the dcast() function in the reshape2 package.
library(reshape2)
#Create ratings matrix. Rows = userId, Columns = movieId
ratingmat <- dcast(ratings, userId~movieId, value.var = "rating", na.rm=FALSE)
ratingmat <- as.matrix(ratingmat[,-1]) #remove userIds
Below is a quick preview of the 706 x 8552 ratings matrix:

Creation of the Recommender Model
The User-based Collaborative Filtering recommender model was created with recommenderlab with the below parameters and the ratings matrix:
Method: UBCF
Similarity Calculation Method: Cosine Similarity
Nearest Neighbors: 30
The predicted item ratings of the user will be derived from the 5 nearest neighbors in its neighborhood. When the predicted item ratings are obtained, the top 10 most highly predicted ratings will be returned as the recommendations.
Normalize the data:
library(recommenderlab)
#Convert rating matrix into a recommenderlab sparse matrix
ratingmat <- as(ratingmat, "realRatingMatrix")

#Normalize the data
ratingmat_norm <- normalize(ratingmat)

#Create Recommender Model. "UBCF" stands for User-Based Collaborative Filtering
recommender_model <- Recommender(ratingmat_norm, method = "UBCF", param=list(method="Cosine",nn=30))
recom <- predict(recommender_model, ratingmat[1], n=10) #Obtain top 10 recommendations for 1st user in dataset
recom_list <- as(recom, "list") #convert recommenderlab object to readable list

#Obtain recommendations
recom_result <- matrix(0,10)
for (i in c(1:10)){
 recom_result[i] <- movies[as.integer(recom_list[[1]][i]),2]
}
And we have easily obtained the top 10 results for user 1! These were the movies recommended to user 1.

The recommenderlab package also provides an easy way to evaluate your model.
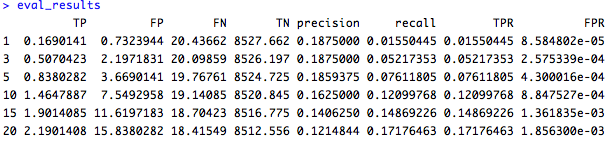
evaluation_scheme <- evaluationScheme(ratingmat, method="cross-validation", k=5, given=3, goodRating=5) #k=5 meaning a 5-fold cross validation. given=3 meaning a Given-3 protocol
evaluation_results <- evaluate(evaluation_scheme, method="UBCF", n=c(1,3,5,10,15,20))
eval_results <- getConfusionMatrix(evaluation_results)[[1]]
The evaluation results of the top-N recommender:
Let’s look at the strengths and weaknesses of the User-based Collaborative Filtering approach in general.
Strengths: User-based Collaborative Filtering gives recommendations that can be complements to the item the user was interacting with. This might be a stronger recommendation than what a content-based recommender can provide as users might not be looking for direct substitutes to a movie they had just viewed or previously watched.
Weaknesses: User-based Collaborative Filtering is a type of Memory-based Collaborative Filtering that uses all user data in the database to create recommendations. Comparing the pairwise correlation of every user in your dataset is not scalable. If there were millions of users, this computation would be very time consuming. Possible ways to get around this would be to implement some form of dimensionality reduction, such as Principal Component Analysis, or to use a model-based algorithm instead. Also, user-based collaborative filtering relies on past user choices to make future recommendations. The implications of this is that it assumes that a user’s taste and preference remains more or less constant over time, which might not be true and makes it difficult to pre-compute user similarities offline.
sources: coursera, recommenderlab

[…] this post, I will write about how I created a web application for the recommender system I built in the previous post using the Shiny package in […]
LikeLike
when I run recom_result, I only get the movieID back
LikeLike
Hey, thanks for going through my post!
I think recom_result is returning movieIDs for you because your movies$title column is in type factors, and not strings. The difference here is probably how I read the dataset using read.csv(“movies.csv”, stringsAsFactors=FALSE), and that is probably a good idea because we wouldn’t want our data to be treated as categorical values.
Alternatively, if you just want to see the recom_results quickly for now, you can just convert the movies$title column to strings by adding as.character():
for (i in c(1:10)){
recom_result[i] <- as.character(movies[as.integer(recom_list[[1]][i]),2])
print (recom_result[i])
}
Hope that helps!
LikeLike
thank you for your helping
in Data Preprocessing #iterate through matrix , when i run the for loop it gives me an error says: Error in `[<-`(`*tmp*`, i + 1, genmat_col, value = 1) :
subscript out of bounds
so how i can solve it?
thanks
LikeLike
The subscript out of bounds error usually means you’re trying to reference a value that does not exist, like calling column 3 when you only have 2 columns.
You could try printing the values of all the variables in the for loop (genres2, genre_matrix) and see what you’re missing or declared wrongly.
LikeLike